Design for Understanding


Access to Design Document
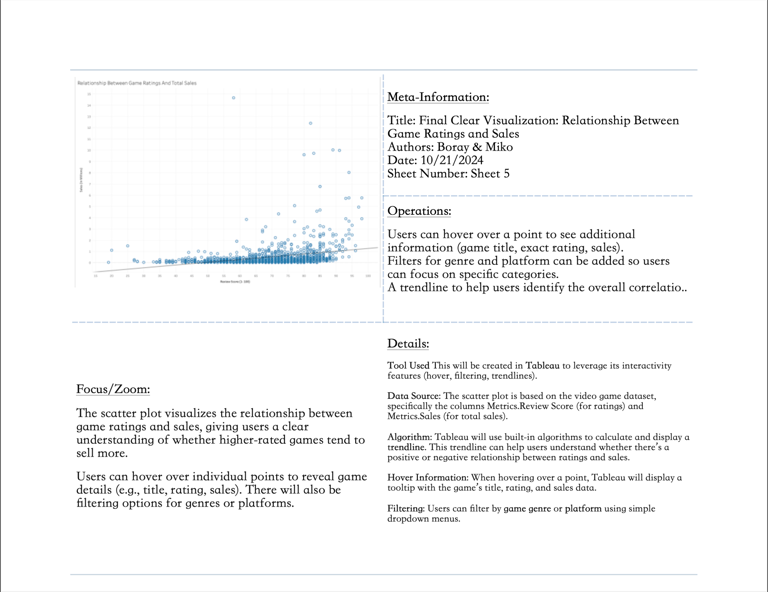
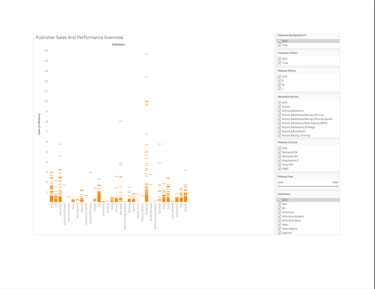
Data Visualization: Clarity vs. Storytelling
This project explores the contrast between neutral data presentation and persuasive storytelling using video game sales data.
Key Features:
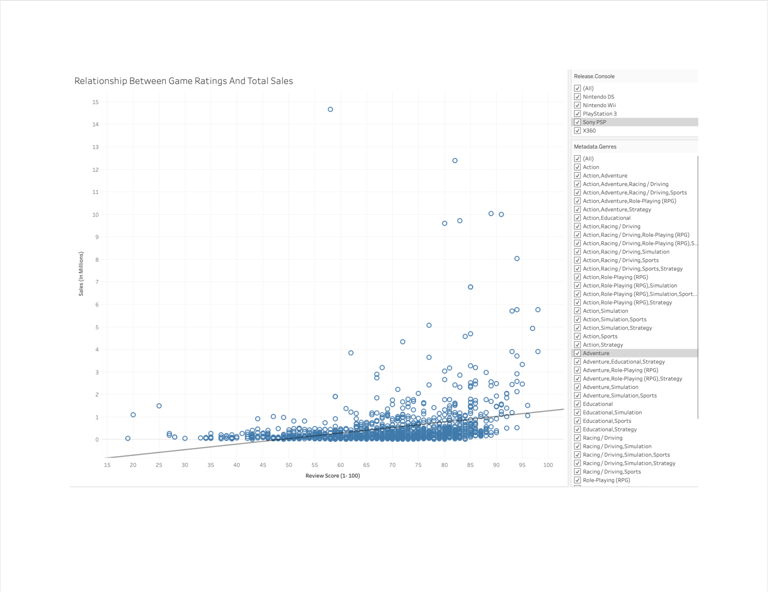
• Clear Visualizations: Neutral charts like scatter plots emphasize objectivity.
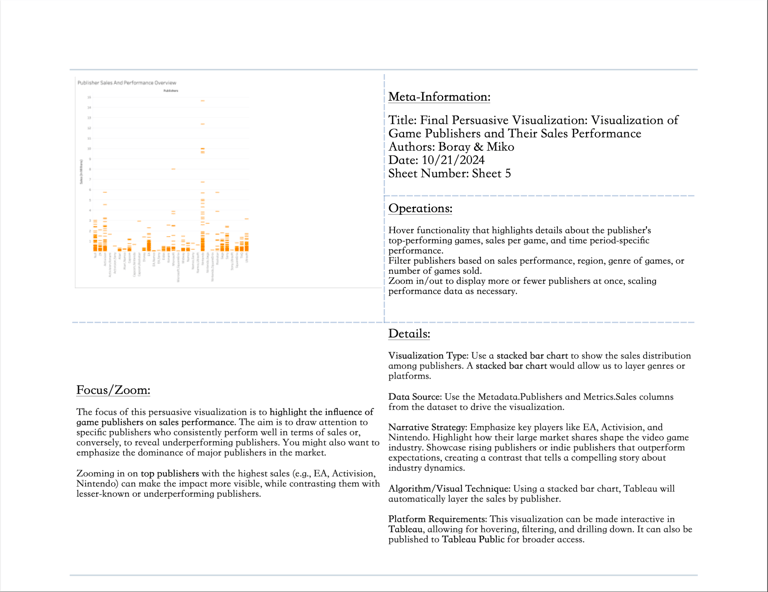
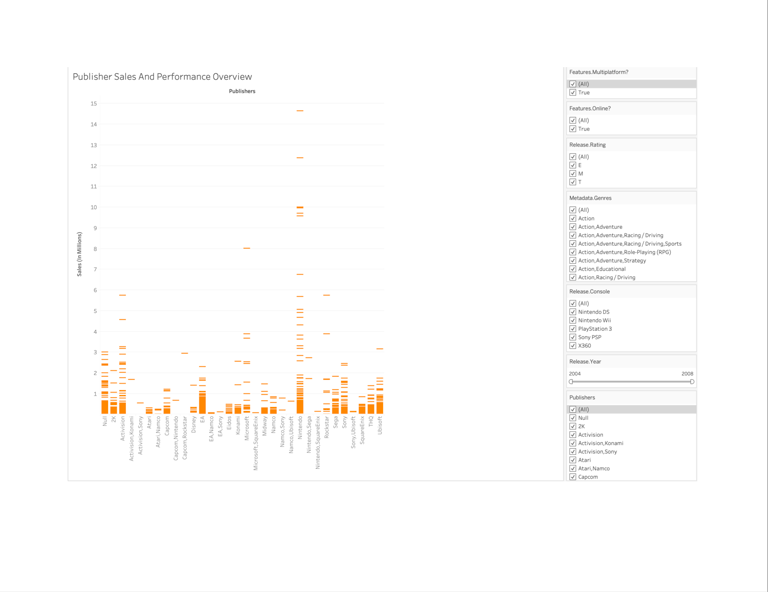
• Persuasive Storytelling: Interactive elements and bold highlights guide viewers toward key insights.
The visualizations demonstrate how design influences data interpretation and engagement.